Explore, search, filter and order the Protein Interaction database to find your ressources.
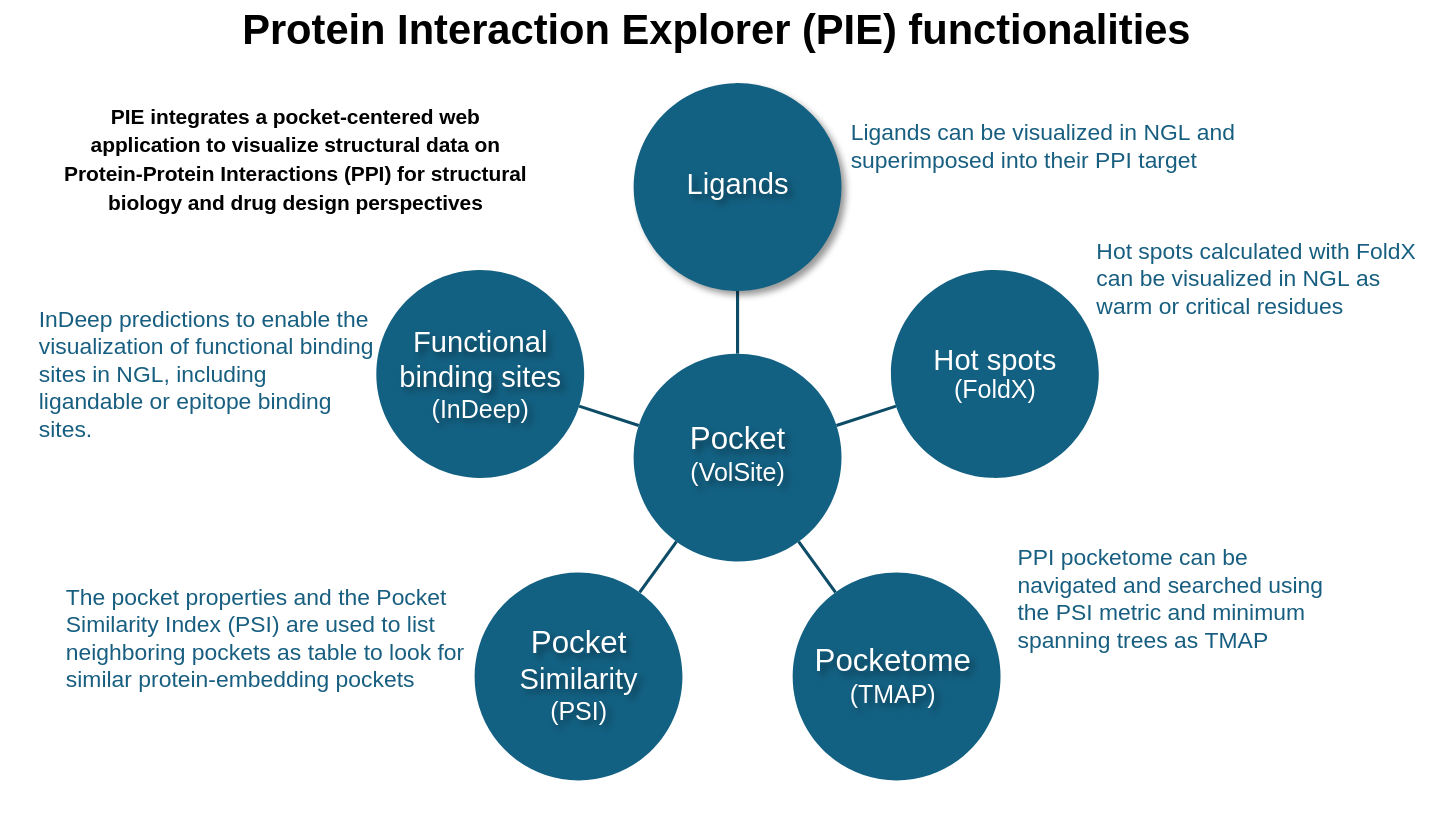
OverviewExplore a graphical representation of pocket properties and pocket clustering within an interactive TMAP.
TMAPSearch Pattern : P42345 , 2 result(s)
First pdb is loaded below
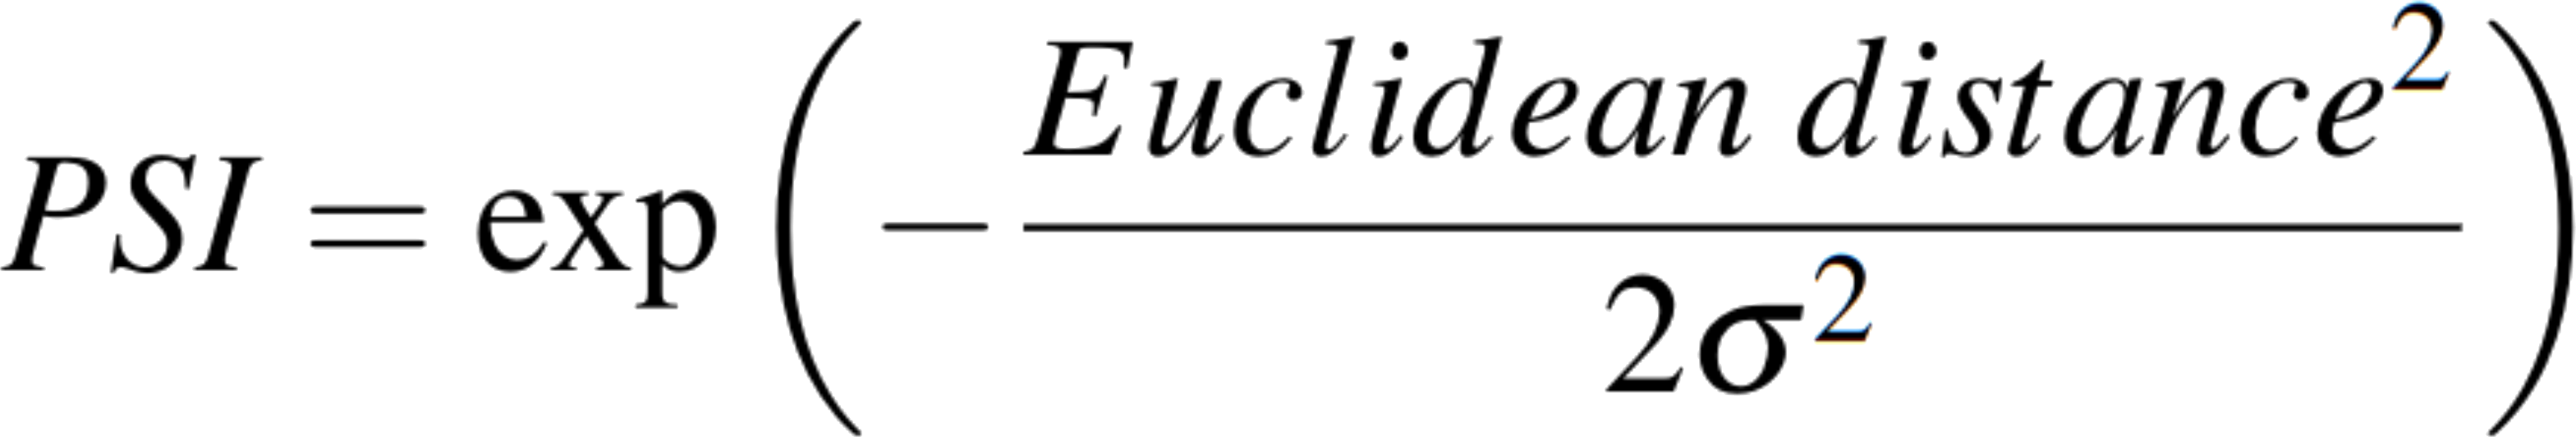
The color gradient for the table is based on maximum and minimum PSI (Pocket Similarity Index) in the matrix. PSI is given when you mouseover a pocket name.
Table of descriptors for each pocket, detected by Volsite (Desaphy et al., 2012). Click on icon to see closest pockets, based on the Pocket Similarity Index. Pocket name is built with: pdb id / pocket's chain id | name / pocket number :: partner ligand id or chain id | name
| 0.00 | 1.00 |
|
Pockets
|
Type
|
Volume
|
NPR1
|
NPR2
|
Asphericity
|
Eccentricity
|
Rgyr
|
Spherocity Index
|
CA
|
CZ
|
N
|
O
|
OG
|
NZ
|
OD1
|
DU
|
T40
|
T40-50
|
T50-60
|
T60-70
|
T70-80
|
T80-90
|
T90-100
|
T100-110
|
T110-120
|
T120
|
|---|---|---|---|---|---|---|---|---|---|---|---|---|---|---|---|---|---|---|---|---|---|---|---|---|---|---|
|
3fap
/
B | MTOR
/2
::
A | FKB1A
|
O | 63 | 0.35 | 0.90 | 0.29 | 0.94 | 2.38 | 0.33 | 20.6 | 33.3 | 12.7 | 0.0 | 12.7 | 0.0 | 12.7 | 7.9 | 0.0 | 9.5 | 49.2 | 36.5 | 4.8 | 0.0 | 0.0 | 0.0 | 0.0 | 0.0 |